Economics And its Measurement Full Notes Class 12

Table of Content (toc)

Elasticity of Demand:

It is defined as the percentage change in quantity demanded divided by the percentage change in its determinants like price, income and other related goods prices, etc.

Price elasticity of demand:

It is defined as the ratio of percentage change in quantity demand for the commodity to the percentage change in price. It can be expressed as:

Types/Degrees of Price Elasticity of Demand

1. Perfectly Elastic Demand (Ep= ): Demand is said to be perfectly elastic if a negligible change in price leads to an infinite change in quantity demanded. Perfect elastic demand is a theoretical concept. It is hardly found in practical life.
It can be shown by the figure below:

A perfectly elastic demand curve is a horizontal straight line parallel to the x-axis.
2. Perfectly Inelastic Demand (Ep=0): When the demand for a commodity does not change with the change in its price, the demand is said to be perfectly inelastic demand. For example, medicine and salt have perfectly inelastic demand.
It can be shown by the figure below:

In this case, the demand curve becomes a vertical straight line or parallel to the axis.

3. Unitary Elastic Demand (Ep=1): When the percentage change in the quantity demanded is equal to the percentage change in price, the demand for a commodity is said to be unitary
elastic demand. 
It can be shown by the figure below:

The rectangular hyperbola curve DD represents unitary elastic demand.
4. Relative Elastic Demand (Ep>1): When the percentage change in the quantity demanded is more than the percentage change in its price, it is called relatively elastic demand. Such kind of elasticity of demand is found in the case of luxury goods like TV, Car, etc.
In the figure demand curve DD’ represents relatively elastic demand and the curve is flatter.
5. Relatively Inelastic Demand (Ep<1): When the percentage change in the quantity
demanded of a commodity is less than the percentage change in its price, it is called relatively inelastic demand. It is found in case of necessity or basic good like rice,
vegetable, clothes etc.
In the figure demand curve DD’ represents relatively inelastic demand and the curve is
steeper.

Income Elasticity of Demand:

It is defined as the ratio of percentage change in quantity demand for the commodity to the
percentage change in income. It can be expressed as:

Types of Income Elasticity of Demand:

1. Income elasticity greater than unity (Ey>1): When the percentage change in the quantity demanded of a commodity is greater than the percentage change in income of the consumer, then it is called income elasticity greater than unity. In the case of luxury goods, income elasticity of demand is more than unity.
In the figure, the demand curve DD shows a positive and elastic income demand.
2. Income elasticity less than unity (Ey<1): When the percentage change in the quantity
demanded for a commodity is less than the percentage change in income of the consumer,
then it is called income elasticity less than unity. Normal necessity goods such as instant
noodles, biscuits etc. have income elasticity less than unity.
In the figure, the demand curve DD shows a positive but inelastic income demand.
3. Income elasticity equal to unity (Ey=1): When the percentage change in quantity demanded for a commodity is equal to the percentage change in income of the consumer, then it is called income elasticity equal to unity. In the case of comfortable goods such as a table, bed etc. income elasticity of demand is equal to unity.

In the figure, the demand curve DD shows unitary elastic income demand.

4. Zero Income Elasticity (Ey=0): If there is a rise in income and the quantity demanded remains unchanged, then it is called zero income elasticity. In the case of neutral goods like salt, the income elasticity of demand is zero.

In this case, the demand curve becomes a vertical straight line or parallel to the y-axis.
5. Negative Income Elasticity (Ey<0): If with the rise in income, the quantity demanded
declines, then it is called negative income elasticity. In the case of inferior goods, the income elasticity of demand is negative.
In the figure, the demand curve DD shows negative income elasticity and it represents the
the demand curve for inferior goods.

Cross Elasticity of Demand:

The cross elasticity of demand is the relation between the percentage change in demand for a commodity to the percentage change in the price of the related commodity. The cross elasticity of demand between good X and Y is:
If X and Y are substitute goods, Exy is positive. On the other hand, if X and Y are complementary goods, Exy is negative. When goods are non-related, Exy will be 0.

Types of Cross Elasticity of Demand:

There are three types of cross elasticity of demand. They are:
1. Positive Cross Elasticity of Demand (Exy>0): When the quantity demand of a commodity and price of related commodity change in the same direction, the cross elasticity of demand is positive. In the case of a substitute good, the cross elasticity of demand is positive. For example, if the price of tea rises, it will lead to an increase in the demand for coffee. Similarly, a fall in the price of tea will cause a decrease in the demand for coffee. Hence, tea and coffee are substitute goods.

In the figure, the upward sloping demand curve DD shows the positive relationship between

the demand for coffee and the price of tea.
2. Negative Cross Elasticity of Demand (Exy<0): When the quantity demand of a commodity and price of related commodity change in the opposite direction, the cross elasticity of demand is negative. In the case of a complementary good, the cross elasticity of demand is negative.
For example, if the price of a bike falls, assuming the price of petrol remains constant, the
demand for the bike and petrol both increase because both are used jointly. It means that
bike and petrol are complementary goods.

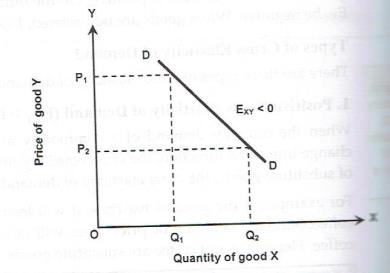
In the figure, the downward sloping demand curve DD shows the negative relationship

between demand for petrol and price of the bike.
3. Zero Cross Elasticity of Demand (Exy=0): When the change in the price of one good has no effect on the demand for another food, the cross elasticity of demand is zero. 
For example, the price of bike and demand for tea has zero cross elasticity of demand. Such goods are also known as unrelated goods.

In the figure, when the price of good Y rises, the quantity demand for good X remains

unchanged.

Measurement of Price Elasticity of Demand by Total Outlay Method:

The total outlay method is also known as the total expenditure method of measuring the price elasticity of demand. Marshall developed this method to measure the price elasticity of demand. 
In this method, we compare the total expenditure of a consumer before and after the variations in price. Looking at the change in total expenditure due to a change in price, we can say whether the demand for a good is elastic, unitary elastic and inelastic. 
Total outlay is the price multiplied by the quantity of a good purchased. I.e. Total outlay (Total Expenditure) = Price * quantity purchased.

Case

Price

Quantity

Total Expenditure

Price elasticity of demand (Ep)

1

6

1

6

Ep>1

5

2

10

2

4

3

12

Ep=1

3

4

12

3

2

5

10

Ep<1

1

6

6

  1. In the first case, when the total expenditure increases with the fall in price and vice versa, then it is called elasticity greater than unity or elastic demand.
  2. In the second case, when the total expenditure remains unchanged with a fall or rise in price, then it is called elasticity equal to unity or unitary elastic demand.
  3. In the third case, when the total expenditure decreases with the fall in price and vice versa, then it is called elasticity less than unity or inelastic demand.
In the figure TG is total expenditure curve. The AB part of TG curve represents elasticity of
demand greater than unity because total expenditure increases with the fall in price. CD part of TG represents unitary elastic demand because with the rise and fall in price, total expenditure remains same. DF part of TG curve represents elasticity of demand less than unity because total expenditure decreases with the fall in price.

Point Method:

Point method is also an important method of measuring price elasticity of demand. It is also
known as the geometric method or graphical method. This method was developed by Alfred
Marshall. This method measures the price elasticity of demand at a particular point of demand curve. This method is used when small change in price of the commodity results in very small change in its quantity demand.
Following formula is used to measure the price elasticity of demand using point method.
Alfred Marshall argued that, the price elasticity of demand on a demand curve is different at
different points of demand curve. Thus, we can find our price elasticity at any point along a
demand curve by the help of the point method using above formula.
It can be explained with the help of the figure below.
In the figure, X axis represents quantity demand and Y axis represents price of the commodity.
The downward slopping curve AE represents linear demand curve. Let us suppose C as the
middle point of the demand curve AE. Using the formula of point method, we can find out price elasticity of demand at different points of the demand curve.
Hence, at the point C, demand is unitary elastic.

Hence, at the point A, demand is perfectly elastic.

Hence, at the point B, demand is perfectly elastic.

Hence, at the point D, demand is relatively elastic.

Hence, at the point E, demand is relatively inelastic.

So in this way, using the formula of point method, we can calculate the price elasticity of demand at different points of the demand curve.

Determinants of Price Elasticity of Demand:

Elasticity of demand for any commodity is determined by a number of factors which are explained below as:

  1. Goods having several uses: If a commodity has several uses, it has an elastic demand. For example, electricity has several uses.
  2. Income of the consumer: The elasticity of demand also depends on income of the consumers. If the income of consumer is high, then the elasticity of demand is less elastic. If the income of consumer is low, then the elasticity of demand is elastic.
  3. Postpone of the consumption: Those commodities whose consumption can be postponed, will be elastic. Goods, whose demand cannot be postponed, will have inelastic demand.
  4. Habits: If people are habituated to the consumption of particular commodity, like, coffee, momo, chocolate, the demand for such commodity will have inelastic demand.
  5. Price level: When the price level is too high or too low, the demand will be comparatively inelastic. For medium range prices, the demand for commodities is elastic.
  6. Time factor: If the time period of consumption is very short, then elasticity of demand will be less than one, and if the time period of consumption is long, then elasticity of demand will be more than one.

Elasticity of Supply

It is defined as the ratio of percentage change in quantity supplied to the percentage change in price. It can be expressed as:
Since, there is positive relationship between price and quantity supplied, the
coefficient of price elasticity of supply is positive.
Types/Degrees of Price Elasticity of Supply
1. Perfectly Elastic Supply (Es= ): Supply is said to be perfectly elastic if negligible change in price leads to infinite change in quantity supplied. Perfect elastic supply is theoretical
concept. It is hardly found in practical life. It can be shown by the figure below:

Perfectly elastic supply curve is a horizontal straight line parallel to the x-axis.

2. Perfectly Inelastic Supply (Es=0): When the supply of a commodity does not change with the change in its price, the supply is said to be perfectly inelastic supply. It can be shown by the figure below:

In this case supply curve becomes vertical straight line or parallel to the axis.


3. Unitary Elastic Supply (Es=1): When the percentage change in the quantity supplied is equal to the percentage change in price, the supply of a commodity is said to be unitary elastic supply. For example, if a 20% change in price causes 20% change in supply, it is the case ofunitary elastic supply. It can be shown by the figure below:

The upward slopping curve SS represents unitary elastic supply.


4. Relative Elastic Supply (Es>1): When the percentage change in the quantity supplied is
more than percentage change in its price, it is called relatively elastic supply.

In the figure supply curve SS represents relatively elastic supply and the curve is flatter.


5. Relatively Inelastic Supply (Es<1): When the percentage change in the quantity supplied of a commodity is less than the percentage change in its price, it is called relatively inelastic supply.
In the figure supply curve SS represents relatively inelastic supply and the curve is steeper.

Questions for Practice:

Very Short:
1. What is price elasticity of demand?
2. What is income elasticity of demand?
3. What is cross elasticity of demand?
4. What is elasticity of supply?
5. What is elasticity of demand?
Short:
1. What are the determinants of elasticity of demand?
2. Discuss the positive, negative and zero cross elasticity of demand.
3. What are the types of price elasticity of demand?
4. How price elasticity of demand is it measured by total outlay method?
5. What are the types of income elasticity of demand?

Long:
1. What is price elasticity of demand? Explain its various types.
2. What is income elasticity of demand? Explain its various types.
3. What is elasticity of supply? Explain its various types.